Introduction to Statistics
The word statistics comes from the Latin word statute of state, which means state affairs.
In ancient times, statistics was mainly used to study population and poverty.
Nowadays, statistics is used in economics, business, banking, administration, research, health, education, and many other fields.
A collection of numerical facts is called data.
The collected numerical information is called quantitative data.
Data can be presented in:
• Individual series
• Discrete series
• Continuous series
18.1 Line Graph and Pie Chart
18.1.1 Line Graph
A line graph represents data that changes over time using points joined by straight lines.
It is used to show changes such as temperature, population, wages, rainfall, etc.
Steps to Construct a Line Graph
Take horizontal axis (X-axis) for independent data
Take vertical axis (Y-axis) for dependent data
Plot points according to given data
Join the points with straight lines
18.1.2 Pie Chart (Angular Diagram)
A pie chart is a circular diagram divided into sectors.
Each sector represents data proportional to its frequency.
Total circle = 360° = 100%
Formula
Central angle
= (Frequency ÷ Total frequency) × 360°
[FIG 2]
18.2 Histogram and Cumulative Frequency Curve
18.2.1 Histogram
A histogram is a graphical representation of continuous data using rectangular bars.
• X-axis → class intervals
• Y-axis → frequencies
• Bars touch each other
Steps to Construct Histogram
Convert raw data into grouped frequency table
Take class intervals on X-axis
Take frequency on Y-axis
Draw rectangles of equal width
[FIG 3]
18.2.2 Cumulative Frequency Distribution
The sum of frequencies added successively is called cumulative frequency (c.f.).
Types:
• Less than cumulative frequency
• More than cumulative frequency
18.2.3 Cumulative Frequency Curve (Ogive)
• Less than ogive → increasing curve
• More than ogive → decreasing curve
Ogive is drawn by plotting cumulative frequency against class boundaries.
18.3 Measures of Central Tendency
18.3.1 Arithmetic Mean
Mean is the average value of data.
Mean of Individual Series
Mean = Σx ÷ N
Where,
Σx = sum of all observations
N = number of observations
Mean of Discrete Series
Mean = Σfx ÷ Σf
Where,
Σfx = sum of product of x and f
18.3.2 Median
Median is the middle value of arranged data.
Median of Individual Series
Position of median = (N + 1) ÷ 2
If N is even → average of two middle values
Median of Discrete Series
• Arrange data in ascending order
• Prepare cumulative frequency table
• Find c.f just greater than (N + 1)/2
18.3.3 Quartiles
Quartiles divide data into four equal parts.
• Q₁ → first quartile (25%)
• Q₂ → second quartile (median)
• Q₃ → third quartile (75%)
Formulas
Q₁ position = (N + 1)/4
Q₂ position = (N + 1)/2
Q₃ position = 3(N + 1)/4
18.3.4 Mode
Mode is the most repeated value.
• In individual series → most frequent value
• In discrete series → value with highest frequency
10 Important Exam Questions (Solved)
1. Find the mean of 4, 6, 10, 14.
or, Σx = 4 + 6 + 10 + 14 = 34
or, N = 4
or, Mean = 34 ÷ 4
or, Mean = 8.5
2. Find the median of 7, 2, 9, 5, 4.
or, Arranged data = 2, 4, 5, 7, 9
or, N = 5
or, Median position = (5 + 1)/2 = 3
or, Median = 5
3. Find the mode of 2, 3, 3, 5, 6, 3, 4.
or, 3 appears maximum times
or, Mode = 3
4. Find mean of discrete data
x246f352
or, Σfx = 6 + 20 + 12 = 38
or, Σf = 10
or, Mean = 38 ÷ 10
or, Mean = 3.8
5. Find median of 10, 20, 30, 40, 50, 60.
or, N = 6
or, Median = (30 + 40) ÷ 2
or, Median = 35
6. If mean of 5, 7, x, 9 is 8, find x.
or, Σx ÷ 4 = 8
or, (21 + x) = 32
or, x = 11
7. Find Q₁ and Q₃ of 3, 7, 9, 12, 15, 18, 21
or, N = 7
or, Q₁ position = (7 + 1)/4 = 2
or, Q₁ = 7
or, Q₃ position = 3(8)/4 = 6
or, Q₃ = 18
8. What type of data is shown by histogram?
or, Continuous data
9. Which curve is increasing in ogive?
or, Less than ogive
10. What is the total angle of pie chart?
or, Total angle = 360°
For further practice visit this link !!
https://besidedegree.com/exam/s/academic
Gallery
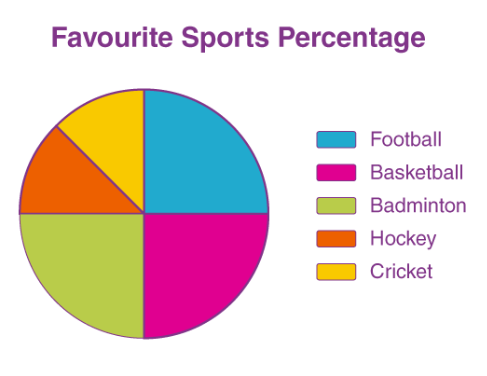
Fig 2
Fig 2

Fig 3
Fig 3